Calling commands
Recall that the device profile (the camera monitor profile in this walkthrough) included a
number of commands to get and set information from any device of that
type. Also recall that the device (the countcamera1 in this walkthrough) was associated to
the device profile (again, the camera monitor profile) when the device was
provisioned.
See core command API for more details.
With the setup complete, you can ask the core command micro
service for the list of commands associated to the device (the
countcamera1). The command micro service exposes the commands in a common, normalized
way that enables simplified communications with the devices for
- other micro services within EdgeX Foundry (for example, an edge analytics or rules engine micro service)
- other applications that may exist on the same host with EdgeX Foundry (for example, a management agent that needs to shutoff a sensor)
- any external system that needs to command those devices (for example, a cloud-based application that determined the need to modify the settings on a collection of devices)
Walkthrough - Commands
Use either the Postman or Curl tab below to walkthrough getting the list of commands.
Make a GET request to http://localhost:48082/api/v1/device/name/countcamera1.
Note
Please note the change in port for the command request above. The command micro service is at port 48082 by default.
Make a curl GET request as shown below.
curl -X GET localhost:48082/api/v1/device/name/countcamera1 | json_pp
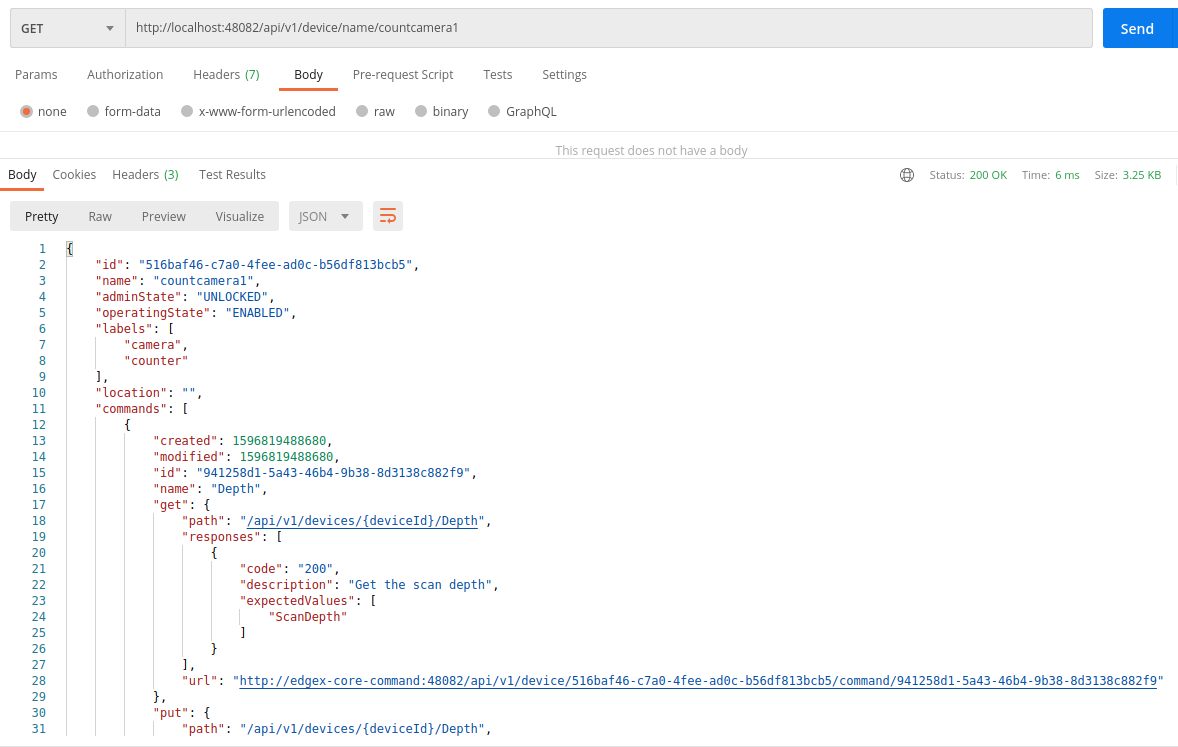
Explore all of the URLs returned as part of this response! These are the URLs that clients (internal or external to EdgeX) can call to trigger the various get and put offerings on the Device. However, do take note that the host for the URLs is edgex-core-command. This is the name of the host for core command inside Docker. To exercise the URL outside of Docker, you would have to use the name of the system host (localhost if executing on the same box).
Check the Value Descriptors
See core data API for more details.
See that the value descriptors are in core data. There should be a total of 4 value descriptors in core data. Note that value descriptors are stored in core data, yet referenced by several objects in core metadata. This is because as data coming from a device is sent to core data, core data may need to validate the incoming values against the associated value descriptor parameters (like min, max, etc.) but without having to make a trip to core metadata to do that validation. Getting data into core data is a key function of EdgeX and must be accomplished as quickly as possible (without having to make additional REST requests).
Walkthrough - Value Descriptors
Use either the Postman or Curl tab below to walkthrough getting the list of value descriptors.
Make a GET request to http://localhost:48080/api/v1/valuedescriptor.
Note
Again, note the change in port for the core micro service request above. The core micro service is at port 48080 by default.
Make a curl GET request as shown below.
curl -X GET localhost:48080/api/v1/valuedescriptor | json_pp
Check the Events
While we're at it, check that no data has yet been shipped to core data from the camera device. Since the device service and device in this demonstration are wholly manually driven by you, no sensor data should yet have been collected. You can test this theory by asking for the count of events in core data.
Walkthrough - Events
Use either the Postman or Curl tab below to walkthrough getting the list of events.
Make a GET request to http://localhost:48080/api/v1/event/count.
Make a curl GET request as shown below.
curl -X GET localhost:48080/api/v1/event/count
Execute a Command
While there is no real device or device service in this walkthrough, EdgeX doesn't know that. Therefore, with all the configuration and setup you have performed, you can ask EdgeX to set the scan depth or set the snapshot duration to the camera, and EdgeX will dutifully try to perform the task. Of course, since no device service or device exists, as expected EdgeX will ultimately responds with an error. However, through the log files, you can see a command made of the core command micro service, attempts to call on the appropriate command of the fictitious device service that manages our fictitious camera.
For example sake, let's launch a command to set the scan depth of
countcamera1 (the name of the single human/dog counting camera device in
EdgeX right now). The first task to launch a request to set the scan
depth is to get the URL for the command to put or set a new scan
depth on the device. Return to the results of the request to get a list of the commands by the
device name above.
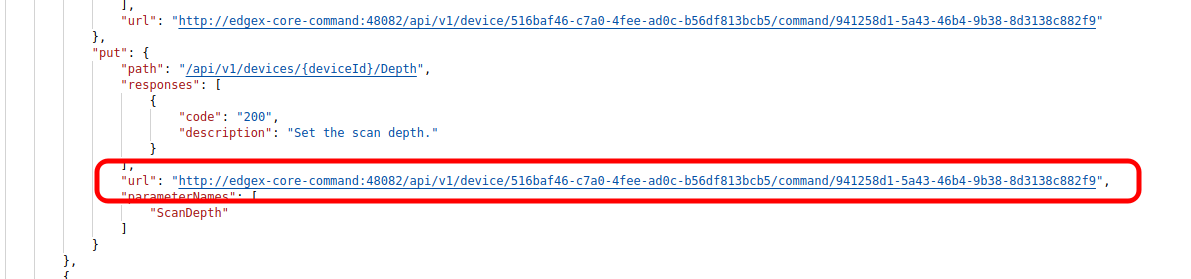
Locate and copy the URL for the put depth command. Because of the
IDs used, the IDs you see in the image above will be different on each system so a generic API call
will not suffice here. Below is a picture containing a slice of the JSON
returned by the GET request above and desired put Command URL
highlighted - yours will vary based on IDs.
Walkthrough - Actuation Command
Use either the Postman or Curl tab below to walkthrough actuating the device.
Make a PUT request to http://localhost:48082/api/v1/device/<system specific device id>/command/<system specific command id> with the following body.
{"depth":"9"}
Warning
Notice that the URL above requires you to plugin the device and command IDs from your command list.
Make a curl PUT request as shown below - replacing the device id and command id obtained from your command list.
curl -X PUT -d '{"depth":"9"}' localhost:48082/api/v1/device/<system specific device id>/command/<system specific command id>
Check Command Service Log
Again, because no device service (or device) actually exists, core
command will respond with a connection refused error. However,
checking the logging output will prove that the core command micro
service did receive the request and attempted to call on the
non-existent device service (at the Addressable address provided earlier in this walkthrough) to issue the actuating command. To see the core command service log issue the following Docker command :
docker logs edgex-core-command
level=ERROR ts=2020-08-07T17:58:41.427153136Z app=edgex-core-command source=types.go:41 msg="Put http://localhost:49977/api/v1/devices/516baf46-c7a0-4fee-ad0c-b56df813bcb5/Depth: dial tcp 127.0.0.1:49977: connect: connection refused"
level=ERROR ts=2020-08-07T17:58:41.427220406Z app=edgex-core-command source=handler.go:47 msg="Put http://localhost:49977/api/v1/devices/516baf46-c7a0-4fee-ad0c-b56df813bcb5/Depth: dial tcp 127.0.0.1:49977: connect: connection refused"